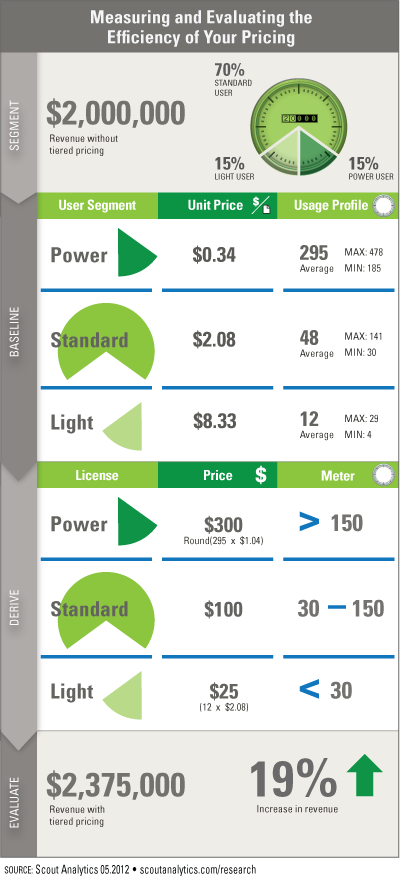
Segmentation in all pricing helps companies develop targeted plans for different groups of customers. Segmentation can be based on demographics, firmographics, or behavior. From Scout® Research’s benchmarking, demographic and firmographic segmentations consistently underperform behavioral segmentation in yielding the maximum revenue. How much opportunity exists to increase revenue from behavioral segmentation? The following infographic illustrates how to measure and evaluate the efficiency of your pricing.
The infographic analyzes the efficiency of pricing for an online market research service where pricing is based on user roles, for which one specific role is defined to be $100/user/month. The service has 20,000 of these specific users which generates $2,000,000 of revenue per month. As with every service, users have different behavioral patterns that can be stratified. A typical stratification can segment users into Power Users (top 15%), Light Users (bottom 15%), and Standard Users (middle 70%).
After behaviorally segmenting the users, each group can be baselined for average amount of reports consumed per month (i.e., basis of value) and the average price per report (i.e., unit price of value). In this case, the average Power User consumes six times more value than the average Standard User. The average Light User consumes four times less value compared to the average Standard User. The unit price of value uncovers pricing disparities with the Power User at $0.34 per report, which is six times less than the Standard User’s price of $2.08 per report and 24 times less than the Light User’s price of $8.33 per report.
Tiered pricing increases revenue yield from users getting the highest value and can be derived from the baseline data. With the understanding of the Standard User’s price of $2.08 per report, deriving a Power User price can be done with a more streamlined approach. In this example, a “volume discount” of 50% is applied for Power Users, which means their average price per report should be $1.04, and the monthly Power User price would be $300 (rounded down from $307). A Light User price could also be offered if the plan also includes increasing users. In this case, the Light User price would be modeled at $25/user/month. The metering points for Light, Standard, and Power Users are derived by the minimum and maximum usage profiles in each of the segments.
The role-based pricing generates $2,000,000 of revenue per month, whereas derived tiered pricing generates $2,375,000 – a 19% boost on revenue per month. Additionally, if the Light User price increased the user base by bringing in new users, the revenue boost would be even greater.
Of course, there are additional factors to consider and manage – such as conversion rates and stratification parameters – but even when accounting for these factors, pricing based on behavioral segmentation outperforms pricing based on demographic and firmographic segmentation.
The Implication
Unless your pricing model was defined by behavioral segmentation, your pricing is likely to be inefficient. Evaluating your opportunity to improve pricing efficiency is done through behavioral segmentation and understanding price per unit of value. When you have large disparities between what users are paying per unit of value (i.e., per report), you have an opportunity to modify licensing to improve yield and increase revenue.


