In the last research alert, we talked about the “90/10 Rule of Adoption.” That was an observation based on our own real-world data which shows that after 90 days, a non-loyal user has only a ten percent chance of becoming a loyal user.
Like the time-honored 80/20 rule, our 90/10 rule is meant as a guide for setting priorities—and the key takeaway is that adoption is critical to the customer journey. The 90/10 rule of adoption encourages companies to better understand the dynamics of customer adoption, because adoption is often highly correlated with customer retention and renewal revenue.
This correlation between adoption and retention makes intuitive sense: Customers only want to pay for what they actually use, so if adoption is low, then the customer over-purchased and will want to lower or cancel their subscription. On the other hand, if adoption is high, then statistically you’ll have a renewal. Knowing that can help you prioritize and invest in adoption strategies that improve the customer journey and have a real impact on revenue.
Consider the following real-world example from one of the companies using our service to see how adoption impacts customer and revenue retention. In this example, adoption was measured by usage frequency and volume for each user, because the product was priced and sold on a per-user basis.
But exactly which adoption metric proved to have the most predictive lift for the company? It was the ratio of loyal users to purchased users, where a loyal user is defined as being active at least once per week. (Different companies would set this “loyal user” metric differently, such as when a product uses utility-based pricing or is accessed via an API or results are measured by another outcome.)
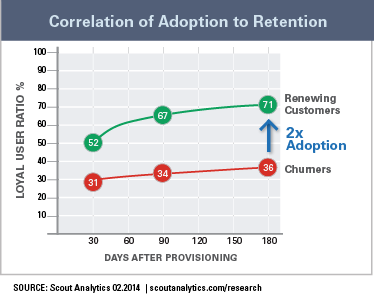
The graph to the right illustrates this correlation between adoption and revenue retention. The green line charts the loyal-user ratio for customers who renewed at the end of the initial term. The red line charts the loyal-user ratio for customers who were down-sells or cancellations (i.e., churners) at the end of the term. The loyal-user ratio for churners was 31 percent after 30 days, compared to the renewing customers’ loyal-user ratio of 52 percent.
Churners also had lower ongoing adoption: At the 90-day mark, churners on average had a loyal-user ratio of 34 percent, while renewing customers averaged 67 percent. At the end of 180 days, churners (again, customers who were ultimately down-sells or cancellations) had on average only 36 percent loyal users, while renewing customers had 71 percent—almost twice the adoption of churners.
The Implication
The bottom line is that adoption has a real impact on renewal revenue—and it’s critical for any customer success team to understand and act on that.
In the case of our example company, the customer success team implemented an automated nurturing campaign for inactive users and drove a 20 percent bump in the user-adoption rate within new customers. Additionally, the campaign cut churn by nine points, an improvement of over 50 percent.
So how do customer success teams find these correlations within their own data, so they can make the internal business case to prioritize adoption efforts? The first step is identifying a set of potential adoption metrics. Next, you need to select a predictive metric (or combination of metrics) via analysis against renewing customers and churners. (Be sure to consider customer segmentation and rate plans when selecting cohorts, because not all your customers will have the same adoption profile.)
From there, you can identify a business case and work to implement a customer success program that improves the customer journey and retains more customers and revenue.


