Posted by: Matt Shanahan
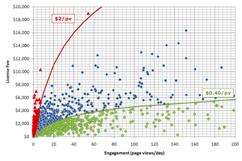
During the last five weeks, I have written extensively about the Demand Map™, a quantitative lens for digital revenue optimization. The Demand Map™ posts describe how the unit cost of engagement can be calculated (i.e., engagement divided by revenue during the period) and used to identify which licenses or ad orders are incorrectly 
Unlocking the true power of the Demand Map™ involves digital revenue allocation. Using digital revenue allocation, the unit cost of engagement is recorded as part of the page view record (i.e., the actual revenue for each page view is allocated and recorded). With revenue now pushed down to the page view level, new reports come alive such as revenue by geography, device, industry, content and author. Analytics is no longer based on page views, and the pivot on revenue is no longer just licenses and orders. The lens for understanding revenue becomes all the rich data available from the Internet.
Using digital revenue allocation, the Demand Map™ can be visualized by any aggregation of page views (e.g., by city or title). The Demand Map™ allows revenue optimization to be understood at a firmographic, geographic, technographic, and demographic level. Digital revenue allocation allows revenue drivers to be examined in a radically expanded context, continually, and in real-time.
Leading publishers know that their ability increase average revenue per user (ARPU) is tied specifically to how efficiently and comprehensively they monetize engagement. Digital revenue allocation is a technique that allows them to avoid hit and miss endeavors of analyzing, targeting, and monetizing engagement.


