Posted by: Matt Shanahan
This is the second in a series on the importance and use of unit cost of engagement in advertising.
In ad-supported media, a pricing disparity is defined as an advertiser paying too much or too little for audience engagement compared to their peer advertisers. Pricing disparities are often hidden because ad rates are charged based on impression quantity (i.e., CPM pricing) which doesn’t account for actual engagement by users. Because brand recall and click-through rates are directly correlated with engagement, the unit cost of engagement (i.e., CPS pricing) can be used to uncover disparities and opportunities for digital revenue optimization.

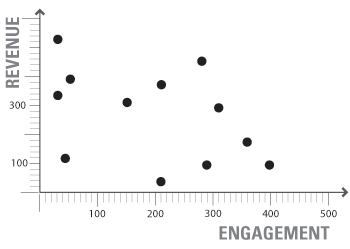
One of the easiest ways to visualize pricing disparities is to plot each ad order according to the order price and the engagement delivered for that order. The typical distribution of orders looks similar to the scatter diagram at the right. The pricing disparities jump right out when you consider the difference in value received by an advertiser in the upper left vs. an advertiser in the lower right of the diagram.
Now of course not every advertiser will receive exactly the same engagement for a specific price, so some amount of pricing disparity will always exist. But can pricing disparity be used to predict advertiser behavior? And what is a reasonable range of disparity? The answer to the first question is yes. The answer to the second question depends on the publisher and their target market.
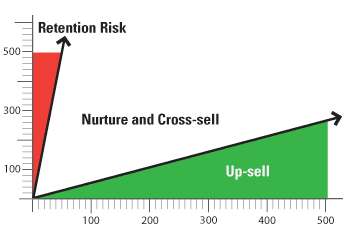
Scout Analytics employs proprietary algorithms to establish minimum and maximum  unit costs of engagement and define a reasonable range of pricing disparity for advertisers in ad-supported media. The output of the analysis is called a Demand Map™, which looks similar to the diagram on the right. The minimum and maximum unit costs are used to predict a minimum and maximum ad rate at each level of audience engagement. The advertisers with ad orders above the maximum fee are retention risks (i.e., likely not to place additional ad orders). Advertisers with ad orders below the minimum fee are up-sell opportunities (i.e., likely to accept a higher price on next ad order). The advertisers with ad orders in between are ones that can be nurtured into higher adoption and make good cross-sell candidates.
The Demand Map™ not only quantifies the number of retention risk and up-sell advertisers, but also the revenue potential they represent.


