Posted by: Matt Shanahan John Lovett has an interesting post Building a Culture of Measurement. The title and content caught my eye because it was embodied a big force behind the development of Demand Rating™. As John stated in his post, “Culture consists of values, beliefs, legends, taboos and rituals that all companies develop over time.” Below are some of our values and beliefs behind Demand Rating. Scout Analytics set out to measure one of the most critical variables in sales, marketing, and product management: visitor loyalty. Our culture is marked by pursuit of an astonishingly simple measurement that has dramatic impact on results. The Demand Rating measurement was originally sparked from a book called How to Measure Anything and […]
Archive | 2010
Demand Ranking™ – When and Where to Sleuth
Posted by: Mark Upson So when and where should you do the deep dive? Demand Rating™ and Demand Ranking™ offer insights to determine when and where analysis is warranted. Evaluating the range on Demand Ratings, the difference between the high and low, provides a uniformity measure of subscriber loyalty. In general, the tighter the range, the more uniform the subscriber loyalty is, and the more uniform the loyalty the less time should be spent comparing subscribers to each other. Outliers, however, can throw a wrench into the works by creating a big range and potentially raising unnecessary analysis. Demand Rankings increase the accuracy of a range by filtering which Demand Ratings should be included. Within a subscriber segment, the Demand […]
Demand Ranking™ – A Deeper Dive

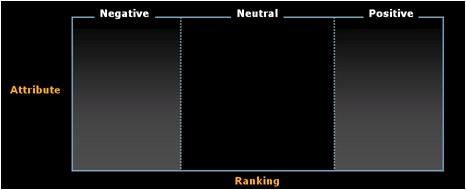
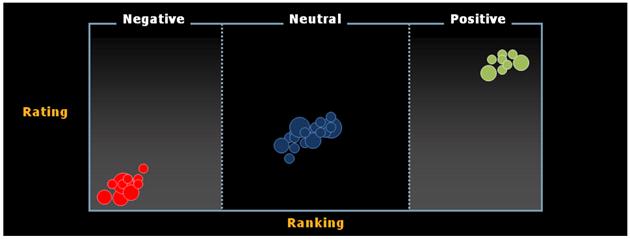
Posted by: Mark Upson Last time, we talked about how Demand Ranking is a statistical method for grouping subscribers based on their Demand Ratings, so let’s take a little deeper dive. Because Demand Ranking gives us a new dimension for comparing and understanding subscribers, it can be correlated with all sorts of firmographic and usage attributes to gain new understanding into loyalty drivers. The visualization of the two dimensions looks something like this where the horizontal axis is the Demand Ranking and the vertical axis is a firmographic or usage attribute: If loyalty is not correlated to a particular firmographic or usage attribute, the visualization looks similar to this: If loyalty is correlated to an attribute, the visualization would look more like […]
New Revenue Insights through Demand Ranking™

Posted by: Mark Upson Like any CEO worth his salt, I look for ways to better understand which prospects and customers are my best sources of revenue. I’m constantly concerned with understanding the drivers of loyalty. In a subscription business, this job is extra tricky. Because of the decoupled nature of purchase and fulfillment, subscriber loyalty can change and adjust over time due to many factors—without an immediate effect on revenue. So how do you get more insight into loyalty drivers? The answer is Demand Ranking™, a statistical qualification of Demand Rating™. While Demand Rating creates the ability to compare demand between customers over time, Demand Ranking enables you to discover the drivers behind subscriber loyalty. Demand Ranking is a quality score that […]


