Tag Archives | Pricing

How to Measure and Evaluate the Efficiency of Your Pricing

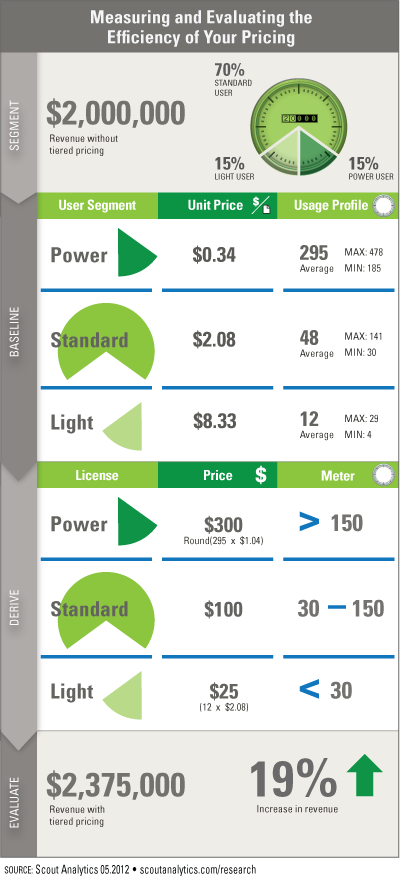
Segmentation in all pricing helps companies develop targeted plans for different groups of customers. Segmentation can be based on demographics, firmographics, or behavior. From Scout® Research’s benchmarking, demographic and firmographic segmentations consistently underperform behavioral segmentation in yielding the maximum revenue. How much opportunity exists to increase revenue from behavioral segmentation? The following infographic illustrates how to measure and evaluate the efficiency of your pricing. The infographic analyzes the efficiency of pricing for an online market research service where pricing is based on user roles, for which one specific role is defined to be $100/user/month. The service has 20,000 of these specific users which generates $2,000,000 of revenue per month. As with every service, users have different behavioral patterns that can […]

Total Disaggregation: The 80/20 Rule of Online News

This is the final post in my series about the transition of print newspapers to online news. In print news, distribution costs led to scarcity, allowing publishers to create an audience and a marketplace for advertisers. Online distribution costs are nearly free, producing massive competition for audience engagement and a disaggregation of the newspaper business model. In addition to new competition for audience engagement from social networking and games, news publishers have to increasingly compete with themselves – the total disaggregation of the newspaper business model. This becomes clear when examining the articles read by an online-news audience. Rather than purchase multiple newspapers, print news readers consume local, regional, national, and international news from one paper. In online news however, […]

The $195 Logic of the New York Times Paywall

new york times paywall

Here is one way to understand the $195 price of a 12-month digital subscription to the New York Times. The price bridges the 2010 gap between average revenue per user (ARPU) for print vs. the ARPU for online. Here is the calculation of the difference. Print ARPU The Newspaper Association of America Trends & Numbers provides details on audience and revenues for US newspapers. Users of print are determined from the print readership which was 152,245,119 in 2010 according to Scarborough Research. Revenue of print is determined from a combination of the advertising and circulation revenues. The print advertising revenue in 2010 was $22,795,000,000. While 2010 circulation revenues have not been provided, most analysts expect them to remain flat compared […]

Why Revenue Estimates for The New York Times Paywall Are Wrong

A digital subscription to the New York Times (NYT) is now a minimum of $195/year ($3.75 per week times 52 weeks). Chatter about the possibility of low subscribership and why $40M was too much to pay is everywhere. The primary logic used by the naysayers of the NYT paywall is that not enough people will pay the minimum $195/year. Whether the paywall will succeed or not, only time will tell, however predictions of revenue based on consumer payment is simply wrong. The logic goes something like this. For consumers, digital news has an anchor price of $0.00 created by years of free access. If a consumer has to pay more, they will take their page views elsewhere. The consequence is […]