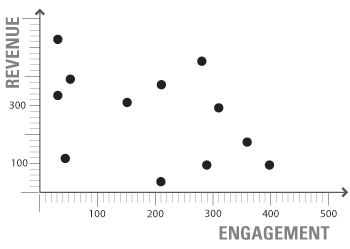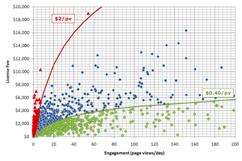
Posted by: Matt Shanahan During the last five weeks, I have written extensively about the Demand Map™, a quantitative lens for digital revenue optimization. The Demand Map™ posts describe how the unit cost of engagement can be calculated (i.e., engagement divided by revenue during the period) and used to identify which licenses or ad orders are incorrectly priced. The chart to the right depicts a example of the Demand Map™. In this chart according to my previous posts, each of the data points could be either a sold license or ad order and the associated engagement. The reality is that the Demand Map™ has more power than just charting licenses and ad orders! Unlocking the true power of the Demand Map™ involves digital […]
Archive | December, 2010
Gawker Media Going to Engagement-based Pricing?
Posted by: Matt Shanahan As my posts have pointed out, engagement is the unit of monetization in digital media. It is always interesting observe the models emerge to monetize engagement. In Felix Salmon’s post The new Gawker Media, he describes an interesting pivot for Gawker Media on the revenue model - charging advertisers for time. Specifically, Felix points out that Gawker Media plans to package content together and promote distribution for certain hours and days of the week similar to TV/cable programming. The assumption must be that there is an audience that wants to “tune in” for the latest from Gawker and that the most engaged audience members would do so at the promoted timeslot. If Gawker Media can construct the audience and predict their engagement, […]
Finding Disparities in Ad Rates Using the Unit Cost of Engagement
Posted by: Matt Shanahan This is the second in a series on the importance and use of unit cost of engagement in advertising. In ad-supported media, a pricing disparity is defined as an advertiser paying too much or too little for audience engagement compared to their peer advertisers. Pricing disparities are often hidden because ad rates are charged based on impression quantity (i.e., CPM pricing) which doesn’t account for actual engagement by users. Because brand recall and click-through rates are directly correlated with engagement, the unit cost of engagement (i.e., CPS pricing) can be used to uncover disparities and opportunities for digital revenue optimization. One of the easiest ways to visualize pricing disparities is to plot each ad order according to the order price and the engagement delivered for that order. The typical distribution of orders […]